A couple of months ago I wrote about using WebPageTest, and more specifically its RESTful API, to monitor the performance of a website. Unarguably, the data it provides can translate to precious information for engineers to tweak various parts of a system to make it perform better.
But how exactly does this tool sit within your development workflow? When should you run tests and what exactly do you do with the results? How do you visualise them?
Now that we have the ability to obtain performance metrics programmatically through the RESTful API, we should be looking into ways of persisting that data and tracking its progress over time. This means being able to see how the load time of a particular page is affected by new features, assets or infrastructural changes.
I set out to create a tool that allowed me to compile and visualise all this information, and I wanted to build it in a way that allowed others to do it too.

¶ The wish list
I wanted this tool to be capable of:
- Running tests manually or have them triggered by a third-party, like a webhook fired after a GitHub release commit
- Running recurrent tests with a configurable time interval
- Testing multiple URLs, with the ability to configure different test locations, devices and connectivity types
- Grouping any number of performance metrics and display them on a chart
- Defining budgets for any performance metric and visualise them on the charts, alongside the results
- Configuring alerts (email and Slack) to be sent when metrics exceed their budget
Before proceeding any further, I have to point out that there are established solutions in the market that deliver all of the above. Companies like SpeedCurve or Calibre offer a professional monitoring tool as a service that you should seriously consider if you’re running a business. They use private instances of WebPageTest and don’t rely on the public one, which means no usage limits and no unpredictable availability.
The tool I created and that I’ll introduce to you during the course of this article is a modest and free alternative to those services. I built it because I don’t have a budget that allows me to pay a monthly fee for a performance monitoring service, and I'm sure other individuals, non-profit organisations and open-source projects are on the same boat. My aim was to bring this type of tooling to people that otherwise might not have access to it.
¶ The idea
The system I had in mind had to have three key components:
- An application that listens for test requests and communicates with the WebPageTest API
- A data store to persist the test results
- A visualisation layer to display them, with a series of graphs to show the progress of the various metrics over time
I really wanted to build something that people of all levels of expertise could set up and use for free, and that heavily influenced the decisions I made about the architecture and infrastructure of the platform.
It may seem like an unusual approach, but GitHub is actually a pretty interesting choice to achieve #2 and #3. With GitHub’s API, you can easily read and write files from and to a repository, so you can effectively use it as a persistent data store. On top of that, GitHub Pages makes the same repository a great place to serve a website from. You get a fast and secure hosting service, with the option to use a custom domain. All this comes for free, if you’re okay with using a public repository.
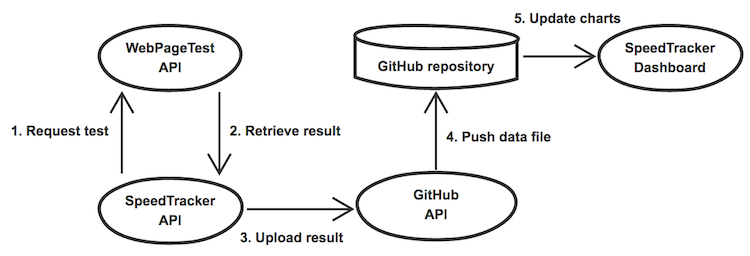
As for #1, I built a small Node.js application that receives test requests, sends them to WebPageTest, retrieves the results and pushes them to a GitHub repository as data files, which will then be picked up by the visualisation layer. I’ve used this approach before when I built Staticman and it worked really well.
The diagram below shows the gist of the idea.

Oh, at some point I needed a name. I called it SpeedTracker.
You can see it in action here or jump straight into using it by following this link. If you want to know more about how it works under the hood, what it was like to build it and where I see it going, then read on.
¶ Building the dashboard
I’m a big fan of Jekyll. For those of you who are not familiar with it, Jekyll is a program that takes structured content from files in various formats (Markdown, JSON, YAML or even CSV) and generates HTML pages. It’s part of a larger family of static site generators.
It’s particularly relevant to this project because of its native integration with GitHub Pages, which enables any repository to automatically build a Jekyll site every time it receives new or updated content and instantly serve the generated HTML files on a designated URL. With this in mind, I could make the API layer write the test results to JSON files and have Jekyll read and output them to a web page.
By storing the data in a GitHub repository, we're putting people in control of their data. It's not hidden somewhere in some service's database, it's on a free, open repository that can easily be downloaded as a ZIP file. And by using JSON, we're choosing a universally-accepted format for the data, making it easier to re-use it somewhere else.
To cater for the requirement of being able to test multiple sites with different devices, connection types and locations, I introduced the concept of profiles. Every test must run against a profile, which consists of a file (see example) that holds information about the URL to be tested and any parameters to be passed to WebPageTest.
In this file, you can also define an interval, in hours, at which tests for the given profile will be repeated. You can change this value, or remove scheduled tests altogether, by changing the interval property in the profile file.
The challenge now was how to deliver results for multiple profiles and offer some basic date filtering functionality (like being able to drill down on results for the past week, month or year) from a static site backed by a bunch of JSON files. I couldn’t simply have Jekyll dump the entire dataset to a page, or the generated HTML files would quickly get prohibitively large.
¶ Jekyll meets React
I started by organising the files in a folder and file structure so that test results were grouped by date and profile. Jekyll could cycle through this structure and generate a list of all the available data files for each site, along with their full paths.
With that list in place, I could build a client-side application that given a profile and a date range, could asynchronously fetch just the files required to display the affected results, extract and compile the various metrics and plot them on a series of interactive charts.
I built that using React.

¶ Performance budgets
A good way to get a team in the right mindset about web performance is to define budgets for one or more metrics and abide by them religiously. Tim Kadlec explains it in this article a lot better than I ever could, but the basic idea is that you specify that your website must load in under a certain amount of time on a certain type of connection.
That threshold must then be taken into account every time you plan on adding a new feature or asset to the site. If the new addition takes you over the budget, you have to abandon it, or otherwise find a way to remove or optimise an existing feature or asset to make room for the new one.
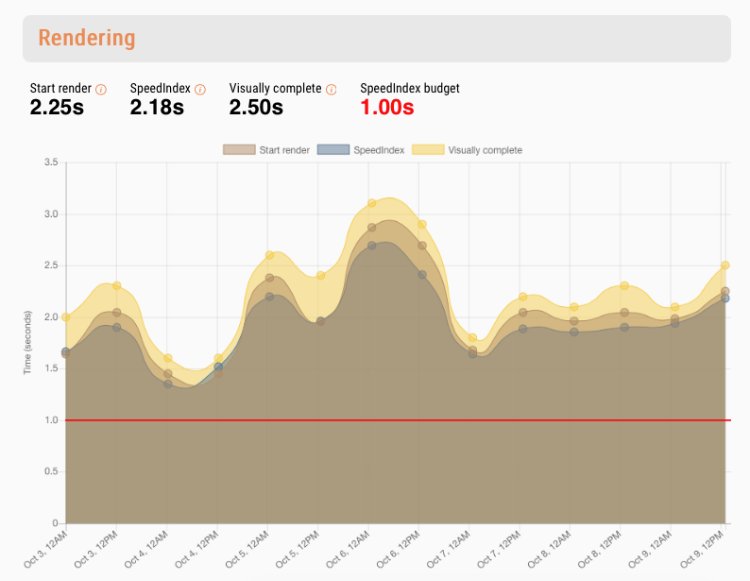
I wanted to give budgets a prominent place in the platform. When creating a profile, you can set a budget for any of the metrics captured and a horizontal line will show in the respective chart alongside the data, giving you a visual indication of how well your site is doing.

It's also possible to define alerts that are triggered when any of the budgets is exceeded, so that you and your team can instantly be notified via email or Slack when things aren't looking so great.
¶ A centralised service
The core idea behind this project was to make this type of tooling free and accessible to everyone. Making it open-source is obviously a big first step, and the fact that you can use free services to deploy both the front-end (GitHub Pages or Netlify) and the back-end (Heroku or now) definitely help. But still, I felt that having to install and deploy the API layer would create barriers for less experienced people.
For that reason, I built the application in such a way that a single instance can be used to deliver test results to multiple sites and GitHub repositories, so effectively it can work as a centralised service that many people can use. There's a server running a public instance of the API, available for anyone to use for free.
This means that all you need to get started is to install the Jekyll site on a GitHub repository, add the username speedtracker-bot as a collaborator, configure a profile and a couple of other things and you're set.
The screencast below can guide you through the process.
¶ Where to go from here
If this tool succeeds at helping some of you improve the performance of your sites, I'll be very happy. If you use it and decide to donate some of your time to help make it better for everyone, I'll be even happier!
Straight away, I can think of some things I'd like to see happening:
- Add support for annotations on the charts to mark specific events, like an infrastructural change or important feature release
- It's already possible to have a GitHub webhook triggering a new test, but we could go a step further and actually read the contents of the webhook payload to create annotations on the charts to mark a commit or release
- Make it easier to display custom metrics
- Add support for scripting
- Better documentation and tests
If you feel you can help, by all means pitch in. If you have any questions or issues in getting started, send me a tweet.
Happy tests! ∎
