While the richness and interactivity of the average website has changed dramatically over the last decade, the same can be said about the expectations of those who consume it. This page has a list of reports that show how businesses were able to establish a direct correlation between the their website's performance and conversion/revenue figures. For example, the engineering team at the Financial Times conducted a test which showed that an increase of just one second in load time caused a 4.9% drop in article views.
The underlying cause is pretty simple and it affects projects of all sizes (yep, including yours): users are becoming more demanding, less patient and not tolerant towards slow websites or applications. If your content takes too long to load, people will go somewhere else. Visiting a site that takes ages to open and navigate is a terrible user experience, especially on the dominant mobile environment where immediacy is crucial and battery life is precious.
For that reason, website performance optimisation plays an increasingly important role in the success of any online property. All major browsers ship with tools that allow developers to keep an eye on some important performance metrics as the build progresses, but these are measured from the developer’s own standpoint, which is not enough to see the full picture.
Factors like geographic location, connection type, device, browser vendor or operating system can heavily influence perceived load times, so testing all these variables is the only way to get a (mildly) accurate representation of how a website is experienced by a broader audience.
There are various tools and services to approach that problem, but this article will focus specifically on WebPageTest. We will look at it from a developer’s perspective, in particular at using its RESTful API to extract vital information you can use to optimise the performance of your site.
¶ About WebPageTest
WebPageTest is an open source performance testing tool, maintained primarily by Google. It consists of one or multiple servers that act as web browsing robots, visiting websites and automatically collecting data about the experience in the form of a detailed performance report.
There is a public instance with a large pool of servers that is available for anyone to use for free, which is what we'll be using in the examples throughout the article. Alternatively, the source code for the platform is available on GitHub, should you want to host it privately on your own infrastructure.
¶ Running a test
When you open the WebPageTest website, you'll see the interface that allows you to run a test straight away. The first thing you need is the URL of the page to be tested. On top of that, there many parameters that can be configured, with the main ones being:
- Connection speed
- Test location
- Whether to capture a video of the test
- Number of tests to run (doing a single run means that the test results are more easily influenced by network or server anomalies, so WebPageTest consider a best practice to run a test multiple times and use the average as a most representative result)
- Single or repeat view (you can choose whether to load a page once or twice per test; because browser cache is cleared before each test, this effectively means deciding whether you’re only interested in the initial, uncached view, or you want a second time to leverage the browser cache).
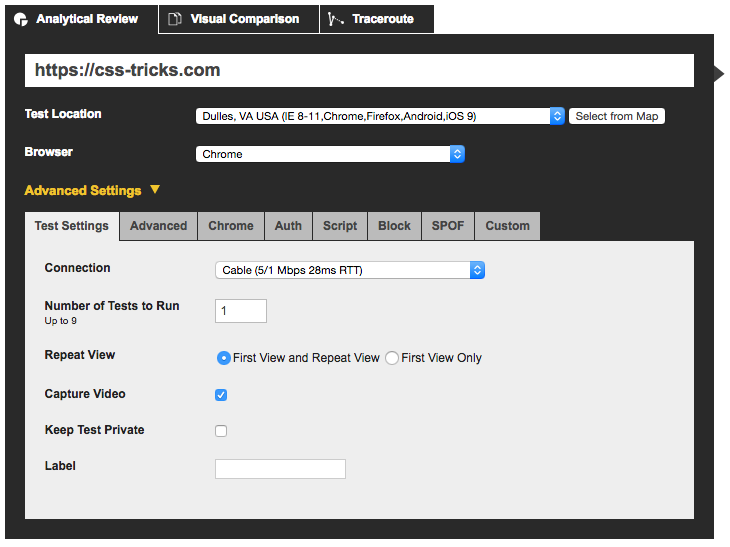
For this example, we're testing https://css-tricks.com with the default settings: Chrome on a Cable connection from Dulles, VA, performing a single run with first and repeat view, with video capturing enabled.
After requesting the test, you will enter a waiting period, as the pool of devices is shared by everyone using the public instance of WebPageTest. For this reason, tests take an unpredictable amount of time to complete, depending on the number of people using the devices and the complexity of the test.
This link contains a list of all available resources and their capacity at any given time.
¶ Reading the results
The amount of information shown in the test reports can be a bit overwhelming, so it’s worth having a look at some of the key metrics returned and what they mean:
- Load Time: The time between the initial request and the browser load event
- First Byte: The time it takes for the server to respond with the first byte of the response (in other words, the time it takes for the back-end to load)
- Start Render: The time until the browser starts painting content to the screen
- Speed Index: A custom metric introduced by WebPageTest to rate pages based on how quickly pages are visually populated (see here for full details on the metric)
- DOM Elements: Number of DOM elements in the page
- Document Complete: Set of metrics relative to the time until the browser load event, with Time, Requests and Bytes In representing the load time, number of requests and number of bytes received, respectively
- Fully Loaded: Similar to Document Complete, but the metrics are relative to the time at which WebPageTest determines that the page has fully finished loading content. This is relevant and different from the above, because pages may decide to load additional content after the browser load event
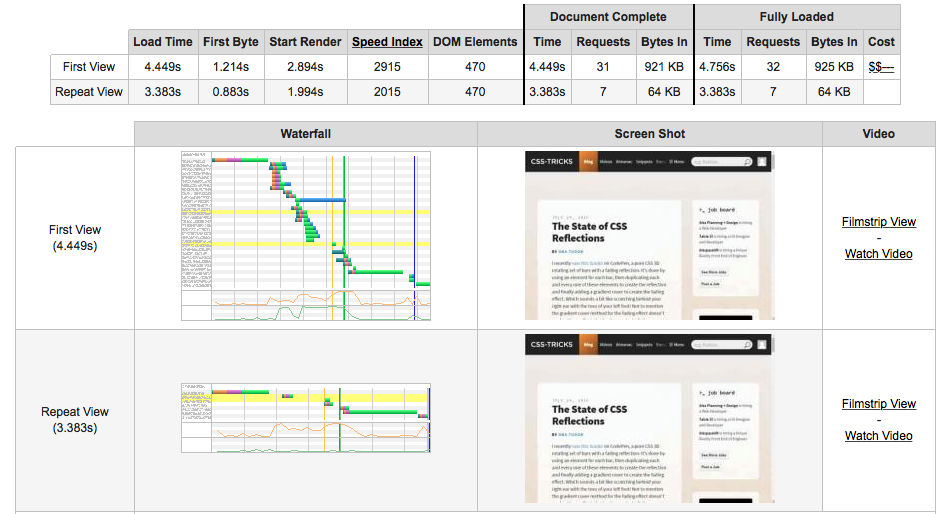
The waterfall view is another key piece of the report. It shows a visualisation of the network activity over time, with each horizontal bar representing an HTTP request. The colours in the bars represent the five phases of a request: DNS lookup (teal), initial connection (orange), SSL negotiation (purple), time to first byte (green), and content download (blue).
It also shows vertical lines to mark key events in the lifecycle of the page, such as the time it takes for the browser to paint the first pixel (green), the point at which the DOM tree is ready (pink), or when the document is loaded (blue). Finally, it shows redirects (highlighted in yellow) and errors (highlighted in red).
We requested a video recording as part of the rest, so WebPageTest gives us a set of frames that visually show the page being drawn on the screen over time. We can use this data to generate a filmstrip view or an actual video.
¶ WebPageTest API
With the basics of the platform covered, let's dive into how we can interact with it programatically.
WebPageTest offers a RESTful API for public use. Because it's a shared instance, usage is limited to 200 page loads per day — repeat views count as a separate page load, which means that a test with two runs and a repeat view would count as four page loads.
It’s also worth mentioning that test results are only kept on the servers for 30 days, so make sure you save any data you might need for posterity (including images and videos) to your own infrastructure.
Anything you can do on the WebPageTest UI can also be done programmatically, as the site itself makes use of the RESTful API. You can request tests and obtain the results, which you can then feed into a variety of outlets, like a data visualisation tool, continuous integration process, trigger Slack or email alerts, or pretty much anything.
The code examples shown throughout the article are written in ES5 JavaScript for a Node.js environment, making use of the WebPageTest API wrapper. But because the API is RESTful, it can be accessed using any language or environment capable of sending an HTTP request, so everything you'll see here can be ported to your language of choice.
¶ Setting up
The first step is to request an API key. After filling in your details, you should get a key straight away.
With that done, we can set up a new Node.js project and install the WebPageTest API wrapper.
npm install webpagetest --savevar WebPageTest = require("WebPageTest");var wpt = new WebPageTest("https://www.webpagetest.org/", "your-api-key");The WebPageTest constructor takes two parameters:
- The URL of the WebPageTest instance (unless you're using a private instance, this will be https://www.webpagetest.org/)
- The API key
¶ Running a test programmatically
We're going to repeat the test we did before, but this time programmatically using the API. We need the runTest function, which takes two parameters:
- The URL of the site being tested
- An object containing a list of options to configure the test (see here for a list of all available options)
wpt.runTest( "https://css-tricks.com", { connectivity: "Cable", location: "Dulles:Chrome", firstViewOnly: false, runs: 1, video: true }, function processTestRequest(err, result) { console.log(err || result); });Remember that requesting a test puts you in a waiting list, so the response you'll get from running the code above is not the actual test result, but more of a receipt that you can use to check on the progress of the test and obtain the results when they're ready.
{ "statusCode": 200, "statusText": "Ok", "data": { "testId": "160814_W7_960", "ownerKey": "ad50468e0d69d1e6d0cda22f38d7511cc4284e40", "jsonUrl": "https://www.webpagetest.org/jsonResult.php?test=160814_W7_960", "xmlUrl": "https://www.webpagetest.org/xmlResult/160814_W7_960/", "userUrl": "https://www.webpagetest.org/result/160814_W7_960/", "summaryCSV": "https://www.webpagetest.org/result/160814_W7_960/page_data.csv", "detailCSV": "https://www.webpagetest.org/result/160814_W7_960/requests.csv" }}We're particularly interested in data.testId, as it contains a string that uniquely identifies our test. We can pass it to the getTestStatus method to check if the test is ready.
wpt.getTestStatus("160814_W7_960", function processTestStatus(err, result) { console.log(err || result);});Eventually (depending on how busy the platform is) you'll get a response containing:
{ "statusCode": 200, "statusText": "Test Complete"}At this point, we know that the test results are ready and we can fetch them using getTestResults.
wpt.getTestResults("160814_W7_960", function processTestResult(err, result) { console.log(err || result);});This method of getting results involves some manual work on our end, as we need to keep calling getTestStatus until we get a 200 response, and only then call getTestResults. There are two alternative (and more convenient) ways of doing this:
- You can pass a
pingbackoption torunTest, containing a URL to be called by WebPageTest once the test is complete. This could be a route in your web server built specifically to handle test results. The test ID will be passed as anidquery parameter, which you could use to callgetTestResults. - You could incorporate all three steps (requesting, polling and retrieving) in the call to
runTestby providing apollResultsoption. Its value, in seconds, represents an interval used to poll the API for the status of the test. The execution will only finish once the test results are returned.
The following example (using option 2) is a combination of all the steps we've seen, and uses one single call to runTest to request a test, poll the API every 5 seconds until the result is ready, and finally output the results.
I'm not going to include the full response here because it's massive (375KB of data!), but you can see it in its entirety here. Instead, we'll see how we can drill down into it to find some of the metrics we described earlier.
wpt.runTest( "https://css-tricks.com", { connectivity: "Cable", location: "Dulles:Chrome", firstViewOnly: false, runs: 1, pollResults: 5, video: true }, function processTestResult(err, result) { // First view — use `repeatView` for repeat view console.log("Load time:", result.data.average.firstView.loadTime); console.log("First byte:", result.data.average.firstView.TTFB); console.log("Start render:", result.data.average.firstView.render); console.log("Speed Index:", result.data.average.firstView.SpeedIndex); console.log("DOM elements:", result.data.average.firstView.domElements); console.log( "(Doc complete) Requests:", result.data.average.firstView.requestsDoc ); console.log( "(Doc complete) Bytes in:", result.data.average.firstView.bytesInDoc ); console.log( "(Fully loaded) Time:", result.data.average.firstView.fullyLoaded ); console.log( "(Fully loaded) Requests:", result.data.average.firstView.requestsFull ); console.log( "(Fully loaded) Bytes in:", result.data.average.firstView.bytesIn ); console.log( "Waterfall view:", result.data.runs[1].firstView.images.waterfall ); });¶ Custom metrics
The metrics shown above are just a small subset of everything WebPageTest captures, as you can see by dissecting the full result payload. But sometimes it's important to measure other things, like metrics that are only relevant to the specific website being tested.
With WebPageTest, we can do this with custom metrics, a feature that allows us to execute arbitrary JavaScript code at the end of a test.
For example, we could be interested in tracking the performance impact caused by the number of iframes that are being loaded, or by any ads being served from a specific provider. Let's see how we can measure that.
var customMetrics = [ "[iframes]", 'return document.getElementsByTagName("iframe").length', "[ads]", 'return Array.prototype.slice.call(document.getElementsByTagName("a")).filter(function (node) { return node.getAttribute("href").indexOf("ad.doubleclick.net") !== -1 }).length'];wpt.runTest( "https://css-tricks.com", { custom: customMetrics.join("\n"), connectivity: "Cable", location: "Dulles:Chrome", firstViewOnly: false, runs: 1, pollResults: 5 }, function processTestResult(err, result) { console.log("Iframes:", result.data.average.firstView.iframes); console.log("Ads:", result.data.average.firstView.ads); });Each metric is defined as a block of JavaScript preceded by an identifier in square brackets, separated by a line break.
To get the number of iframes, we're simply finding and counting all <iframe> elements in the DOM. As for the ads, we're looking at all <a> nodes that contain ads.doubleclick.net in the href attribute. These are simplified examples for the sake of conciseness, but you can define metrics with routines as long and complex as you want.
This article describes custom metrics in depth, offering some really interesting insight on what is worth measuring.
¶ Scripting
By default, a test consists of WebPageTest visiting a site and capturing data until the point it's fully loaded. It then extracts any custom metrics, if defined, and the test if finished. While this works for most cases, WebPageTest offers a scripting functionality that allows you to create more complex, multi-step test routines.
For example, you can create a test that emulates a user clicking on a button, filling details in a login form or pretty much any physical interaction you could normally have with the page.
Scripts consist of a list of instructions containing custom commands (see this link for a list of available commands), encoded in an array of objects that is then converted to a string using a scriptToString method.
When running a scripted test, the normal way of passing the target URL to runTest isn't valid. Instead, the script itself will indicate the link(s) that WebPageTest should follow, so you must include at least one navigate command followed by a URL (values are tab-separated).
By design, there can be only one command outputting test results, so multi-step tests should make use of the logData to toggle the production of results on and off based on the commands you wish to capture.
In the example below, we'll create a test that navigates to https://css-tricks.com and fills in the search box with the term flexbox. At this point, we turn on the output, submit the form and wait for it to complete. This multi-step test will capture the experience of using the search functionality on the site.
var script = wpt.scriptToString([ { logData: 0 }, { navigate: "https://css-tricks.com" }, { setValue: ["id=q", "flexbox"] }, { logData: 1 }, { submitForm: "id=search-form" }, "waitForComplete"]);wpt.runTest( script, { location: "Dulles:Chrome.Cable", firstViewOnly: false, runs: 1, video: true }, function(err, result) { console.log( "Video frames:", result.data.runs[1].firstView.steps[0].videoFrames ); });¶ Single point of failure testing
It's pretty common for websites to rely on third-party sources to deliver key parts of its data, such as fonts or scripts, so it's important to account for the possibility that those services might fail at some point.
This is particularly important when the assets being loaded are render-blocking (i.e. not loaded asynchronously), as trying to load a file from an unavailable source could leave the site hanging for a while until the request times out. The video below shows the effect caused by an outage of the Twitter API on the load times of the Business Insider website.
To make our tests account for this, it's important to get the failing mode right, as described by Patrick Meenan in this article.
Because unavailable services won't typically fail instantly with an error message, setting up a test that tries to load something from a-host-that-doesnt-exist.com isn't good enough, because it doesn't accurately reflect what happens in a real scenario.
Instead, Patrick set up a special server on blackhole.webpagetest.org: as the name suggests, it routes any request made to it to absolutely nowhere. If we intercept all the requests made to the host we're trying to test and redirect them to this black hole server, we have a very good simulation of a real failure scenario.
The example below shows how we could run a test that simulates a failure in code.jquery.com, which many sites use to load jQuery from. We could compare the results obtained with the ones from the normal test to have an idea of the impact this single point of failure would have on the various performance metrics.
var script = wpt.scriptToString([ // Redirecting 'jquery.com' to the black hole server { setDnsName: ["jquery.com", "blackhole.webpagetest.org"] }, { navigate: "https://css-tricks.com" }]);wpt.runTest( script, { location: "Dulles:Chrome.Cable", firstViewOnly: false, runs: 1, video: true }, function(err, result) { // Extract your metrics here });¶ Wrapping up
This article isn't an attempt of a comprehensive guide on WebPageTest, since that's material for an entire book! Instead, we focused on what the platform is, the information it provides and, more specifically, how to interact with it programmatically.
But extracting the data is just the start — it's what we do with it that can impact how our websites perform. I'll follow up soon with my take on using what I've shown here to build a bespoke performance monitoring tool, with the ability to visualise performance metrics over time, establish performance budgets and receive alerts when they're not met. ∎
*Update: Part II of this post is available here.*