As several reports show, it’s possible to correlate poor-performing websites with losses in engagement and revenue, so keeping a close eye on performance is of utmost importance for projects and businesses of all sizes.
To do that, I’m a huge fan and regular user of WebPageTest. Being able to test a website on a variety of devices, connection types and physical locations gives engineers priceless information on the perceived performance for users all across the world.
But I always struggled with how best to integrate it in a project in a way that the data it provides can assist various teams and stakeholders across the board. Not only back-end and front-end engineers could benefit from performance data, but also designers, project managers and directors — in some cases, even users.
More importantly than measuring performance at one isolated point in time, I felt it’d be more valuable to choose a group of metrics and track their progress over time, giving a team an idea of not only how performant their website is, but also how well they’re doing to make it better. By observing how every new feature or infrastructural change affects the various performance metrics, it becomes everyone’s responsibility and goal to make sure performance is considered and budgets are respected.
There are a few enterprise solutions that provide this type of monitoring, but the reality is that not every project can afford to allocate a budget for this. In the true spirit of FOSS, I set out to build a tool that everyone can use (and modify) for free. It’s called SpeedTracker.

¶ The plan
Here’s what it offers:
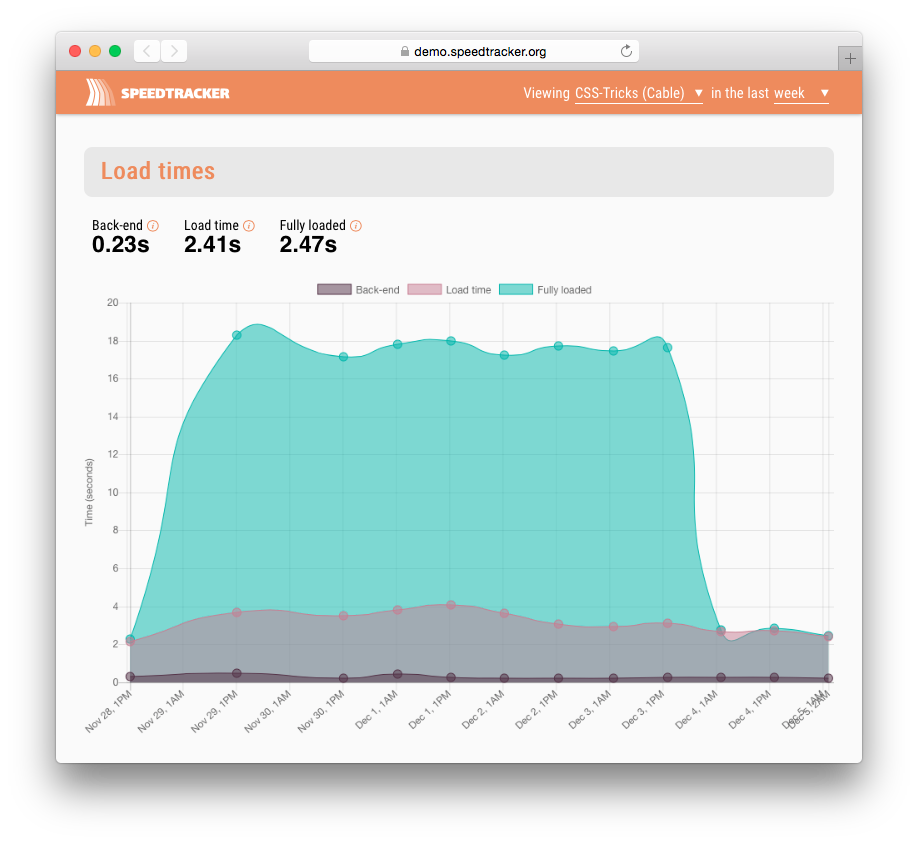
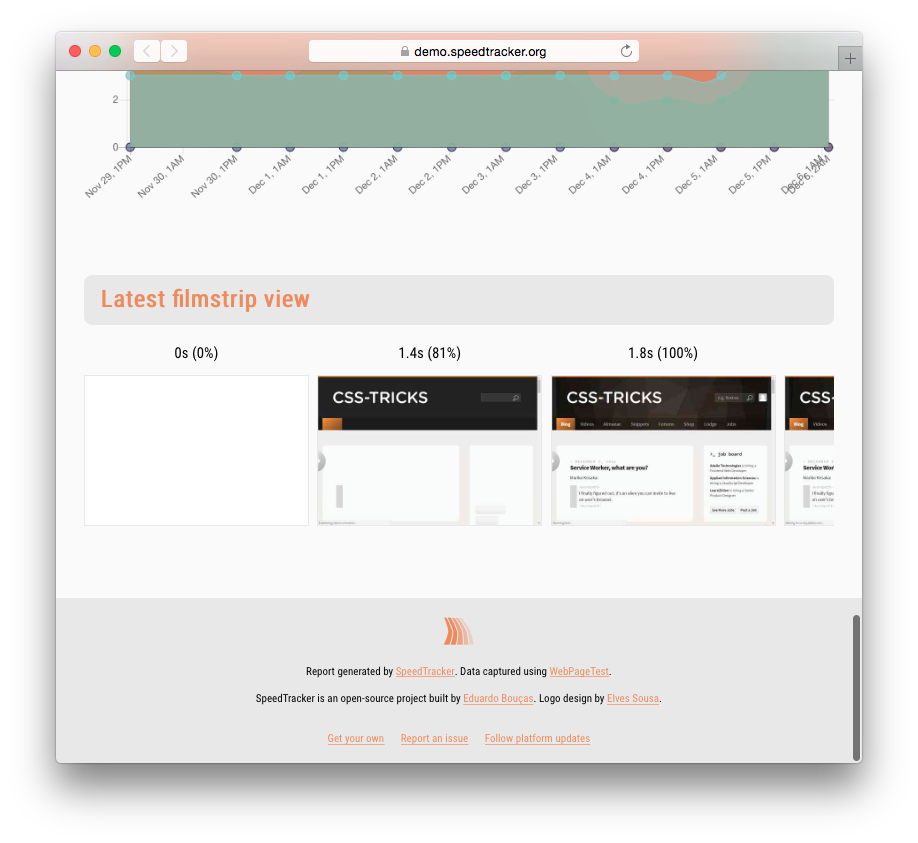
- A simple, easy-to-digest dashboard showing groups of performance metrics on interactive charts
- The ability to request tests manually, scheduled on a regular interval or triggered by a third-party service (like a GitHub webhook)
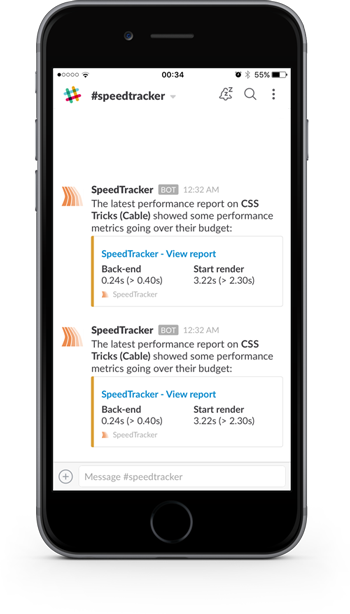
- Performance budgets for any of the metrics tracked and the ability to receive a notification when they’re overran.
The platform consists of an API layer that processes test requests, communicates with the WebPageTest API and pushes the results to a GitHub repository, where the visualisation layer lives. If you don’t wish to deploy your own API, there is a public instance you can use for free.

¶ Getting started
SpeedTracker runs on top of WebPageTest, so you’ll need to get your hands on an API key. If you’re not running a private instance, you can request a key to be used with the free, public instance. This comes with a limit of 200 page loads per day.
The next step is to fork the SpeedTracker dashboard repository to your own GitHub account or organisation and enable GitHub Pages. This repository you’re about to create will be a key component, as we’ll use it as a data store for all test results, and it’s also where we’ll serve the dashboard website from.
Now, the API needs access to the repository so it can start pushing the results. To avoid requesting access to your GitHub account and ending up with broader permissions than what is necessary, you can simply add the user speedtracker-bot as a collaborator to the new repository and then use the connect tool to finalise the connection.
With that done, you can start editing the main configuration file (speedtracker.yml) to enter details like your WebPageTest API key and a chosen passkey that will be used to identify you on every test request. You can also configure notifications (email and Slack) to be sent when a performance budget is overran.
You’ll also need to create a profile (editing the default one is usually a good start), which defines the URL of a page to be tested, as well as parameters such as the connection speed and location. You can also configure a time interval for automatically recurring tests and define performance budgets for any metric. A profile is required for each URL to be tested.
Finally, you can trigger the first test by using the test tool (or by firing a request to the /test endpoint) and your dashboard at https://YOUR-USERNAME.github.io/speedtracker should be populated in a couple of minutes.
¶ See it in action
You can see a demo dashboard tracking the performance of CSS-Tricks.com, which is served from this repository. There is also a dashboard tracking Mozilla’s MDN.

My plan will never be to compete with paid enterprise solutions, but to provide a free and modest alternative that brings this type of tooling to people that otherwise wouldn’t have access to it.
I’m constantly working on the platform and the associated documentation and I’d love to hear from you with any feedback, questions or issues.
Happy tests! ∎
